The Kubernetes network policies you need today
In the dynamic world of Kubernetes, container orchestration is just the tip of the iceberg....
Nov 16, 2022
Kubernetes clusters consist of multiple resources and API objects interacting dynamically—which typically makes cluster management via the CLI overwhelming. Kubernetes Dashboard was built to simplify cluster operations by providing a unified, human-friendly interface. The web-based dashboard enables cluster operators to deploy applications, access running workloads, and correlate logs with cluster events. This article demonstrates how to install and use Kubernetes Dashboard.
Kubernetes Dashboard offers a web-based UI to manage your Kubernetes resources and applications. It displays various macro details of a cluster including nodes, namespaces, volumes, job details, roles, and deployments.
The dashboard presents an intuitive interface to interact with the cluster’s API server, enabling various functions, which we discuss below.
Kubernetes Dashboard provides a wizard to deploy containerized workloads within a deployment. The wizard allows for manual specification of the deployment’s details; you can also automate this by uploading manifest files.
The admin overview displays all namespaces, persistent volumes, and nodes running in the cluster. Each resource of the cluster is displayed alongside associated metrics, specifications, and events.
The dashboard includes separate views for: workloads, services, storage, ConfigMaps, secrets, and logs, allowing cluster operations teams to drill down into specific information for container resource management.
The dashboard offers insights into the cluster state, any errors that may have occurred, and their related events. It also provides a log viewer linked to detail pages and pod lists. You can use this to measure performance benchmarks and workload bottlenecks at the container level.
Although Kubernetes Dashboard stands out as a resourceful platform for beginner practitioners running test clusters, it is considered inefficient for complex production clusters since it lacks extensible authentication support. In large clusters with multiple deployments and namespaces, the dashboard performs sub-optimally and requires a larger memory allocation.
As previously mentioned, Kubernetes’ integrated dashboard does not scale well to provide security guarantees for large production clusters. The tools below can be used to extend the dashboard or provide dashboard-like capabilities for enterprise workloads.
Prometheus is one of the most popular open-source monitoring platforms that collects metrics from various sources (e.g., databases, API servers, etc.), stores them in a time-series database for historical representation, and exposes them via HTTP endpoints. Although the platform is designed to be easy to use, it is powerful enough to provide deep insights into how your applications are performing.
Prometheus is often used with Grafana for comprehensive monitoring of distributed systems. While Prometheus collects, aggregates, and stores metrics about the state of your system, Grafana is an open-source web interface for visualizing cluster health and performance bottlenecks in real time.
Commonly considered the default alternative to Kubernetes Dashboard, the Prometheus-Grafana stack can be installed in a few simple steps through either Helm charts or the Prometheus Operator. The Operator further simplifies the deployment while offering different configuration options for the observability of varying cluster complexities.
The ContainIQ monitoring and tracing solution monitors cluster events, metrics latency, and logs. It ships with pre-built dashboards to expedite cluster health monitoring, while the Kubernetes events monitoring dashboard keeps a historical record of all cluster events and provides alerts for common events like pod eviction and CrashLoopBackOff.
ContainIQ also allows cluster operators to search and filter logs by timestamp, message, cluster, or pod depending on the level of granularity required.
Portainer’s Kubernetes management platform provides a central environment to configure, manage, and secure Kubernetes clusters. The intuitive, open-source tool includes native Kubernetes RBAC support with five predefined roles that administrators can assign to users. Portainer also ships with a quota feature that simplifies the assignment of CPU, RAM, and network capacity limits for fair resource allocation.
Key features of Portainer that make it a suitable alternative to Kubernetes Dashboard include:
Lens is an integrated development environment that provides complete situational awareness for resources and workloads running in Kubernetes. Lens Kubernetes offers managed dev clusters that offload most of the operations required to keep workloads running. Lens desktop provides a way for offloading local clusters to the cloud without any difference in user experience.
The service also includes an intelligent auto-shutdown feature that reduces cost of ownership by terminating idle resources. Operators can additionally deploy self-managed clusters using Lens, enabling flexibility while guaranteeing high security and availability.
Kubescape is an open-source Kubernetes platform that offers a CLI or a web-based interface for securing, monitoring and managing Kubernetes environments like clusters, manifest files (e.g. YAML, Helm), code repositories, container image registries etc. Along with enabling comprehensive monitoring of cluster health, the platform also helps extract detailed information about each cluster node at the granular level.
Kubescape offers a single-pane-of-glass view of K8s components, including pods, services, deployments, ReplicaSets, ingresses, etcd servers, and much more. Through a web interface to the cluster API, Kubescape also allows you to perform common operations such as creating/deleting nodes and scaling up or down. While Kubescape offers rich features in monitoring and managing cluster components, the platform is primarily used for vulnerability assessment, compliance, identifying configuration drifts, and automated security scanning.
K9s is a powerful terminal UI that makes it easy to navigate, observe, and manage containerized Kubernetes workloads. The platform allows developers and administrators to define command shortcuts via hotkeys and aliases to expedite cluster management processes. Via pulses and XRay view, the UI offers granular visualization of resources when orchestrating a cluster.
K9s ships with built-in performance benchmarking to ensure pods and services are assigned with optimum resources and limits.
Although this demo uses a lightweight minikube setup for the installation and use of Kubernetes Dashboard for cluster resource management, you can follow the same steps for a production-grade Kubernetes cluster. As a prerequisite, the demo requires access to the kubectl CLI to deploy the dashboard’s manifest and enable authenticated access.
Connect with the Kubernetes cluster using one of the CLI client terminals, and deploy the recommended configuration for the dashboard by running the command:
$ kubectl apply -f https://raw.githubusercontent.com/kubernetes/dashboard/v2.5.0/aio/deploy/recommended.yaml


Upon successful application, the terminal will display the following output:

namespace/kubernetes-dashboard created
serviceaccount/kubernetes-dashboard created
service/kubernetes-dashboard created
secret/kubernetes-dashboard-certs created
secret/kubernetes-dashboard-csrf created
secret/kubernetes-dashboard-key-holder created
configmap/kubernetes-dashboard-settings created
role.rbac.authorization.k8s.io/kubernetes-dashboard created
clusterrole.rbac.authorization.k8s.io/kubernetes-dashboard created
rolebinding.rbac.authorization.k8s.io/kubernetes-dashboard created
clusterrolebinding.rbac.authorization.k8s.io/kubernetes-dashboard created
deployment.apps/kubernetes-dashboard created
service/dashboard-metrics-scraper created
deployment.apps/dashboard-metrics-scraper created

Confirm the deployment of dashboard resources by listing the pods running within the cluster using the command:

$ kubectl get pods -A

Which returns a response similar to:

NAMESPACE              NAME                                        READY   STATUS      RESTARTS      AGE
ingress-nginx          ingress-nginx-admission-create--1-mzfh6     0/1     Completed   0             17m
ingress-nginx          ingress-nginx-admission-patch--1-2ccwx      0/1     Completed   0             17m
ingress-nginx          ingress-nginx-controller-5f66978484-8rmlp   1/1     Running     0             17m
kube-system            coredns-78fcd69978-996nt                    1/1     Running     0             20m
kube-system            etcd-minikube                               1/1     Running     0             21m
kube-system            kube-apiserver-minikube                     1/1     Running     0             21m
kube-system            kube-controller-manager-minikube            1/1     Running     1 (21m ago)   21m
kube-system            kube-proxy-2ffz6                            1/1     Running     0             20m
kube-system            kube-scheduler-minikube                     1/1     Running     0             20m
kube-system            storage-provisioner                         1/1     Running     0             20m
kubernetes-dashboard   dashboard-metrics-scraper-c45b7869d-rp4gl   1/1     Running     0             12m
The default setting for Kubernetes Dashboard is only minimally configured for RBAC. To log into the dashboard, Kubernetes supports the use of a bearer token, which you can generate by first creating a user service account with administrative privileges. Create the user by specifying the ServiceAccount and ClusterRoleBinding in a file named dashboard-user.yaml with specifications similar to:
apiVersion: v1
kind: ServiceAccount
metadata:
name: admin-user
namespace: kubernetes-dashboard
—
apiVersion: rbac.authorization.k8s.io/v1
kind: ClusterRoleBinding
metadata:
name: admin-user
roleRef:
apiGroup: rbac.authorization.k8s.io
kind: ClusterRole
name: cluster-admin
subjects:
– kind: ServiceAccount
name: admin-user
namespace: kubernetes-dashboard
Apply the above configuration to the cluster:
$ kubectl apply -f dashboard-user.yaml
Which returns a response similar to:
serviceaccount/admin-user created
clusterrolebinding.rbac.authorization.k8s.io/admin-user created
Then, generate the bearer token by running the command:
$ kubectl -n kubernetes-dashboard get secret $(kubectl -n kubernetes-dashboard get sa/admin-user -o jsonpath=”{.secrets[0].name}”) -o go-template=”{{.data.token | base64decode}}”
Which outputs a token similar to the code in the image below (NB: Parts of the output have been omitted for brevity):

Copy this token and store it safely, as it will be used to access the web UI.
First, expose the cluster dashboard to your local machine by running the command:
$ kubectl proxy
Which returns a response of the form:
Starting to serve on 127.0.0.1:8001
The above output implies that the dashboard is accessible through the URL:
Copy and paste this link into the browser to access the dashboard login page. The page will prompt you for the access token:

Paste the bearer token into the Enter token section and then click Sign in.
A successful login will redirect you to a welcome page of the Kubernetes cluster. Note that initially there will be no resources to display:
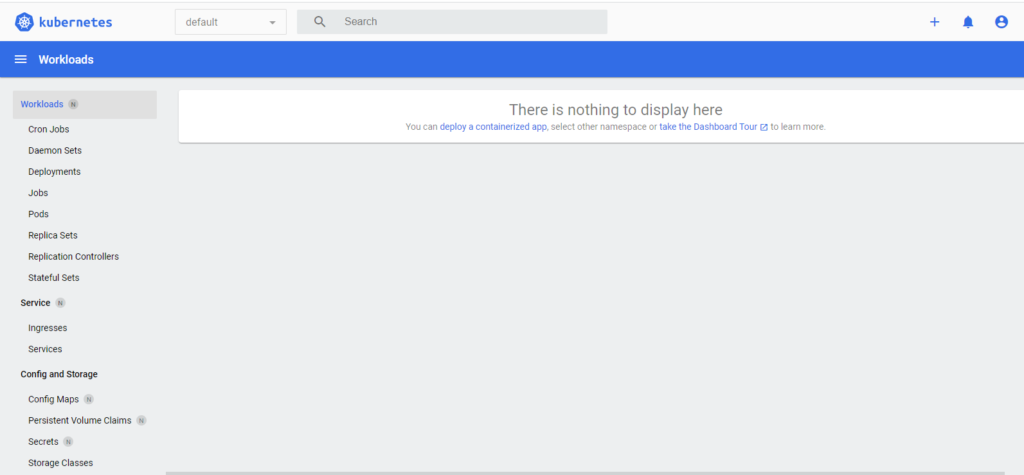
To deploy a new containerized application, click on the + sign toward the top-right area of the dashboard. This offers three options:
Click on Create from form to open the interactive deployment UI:
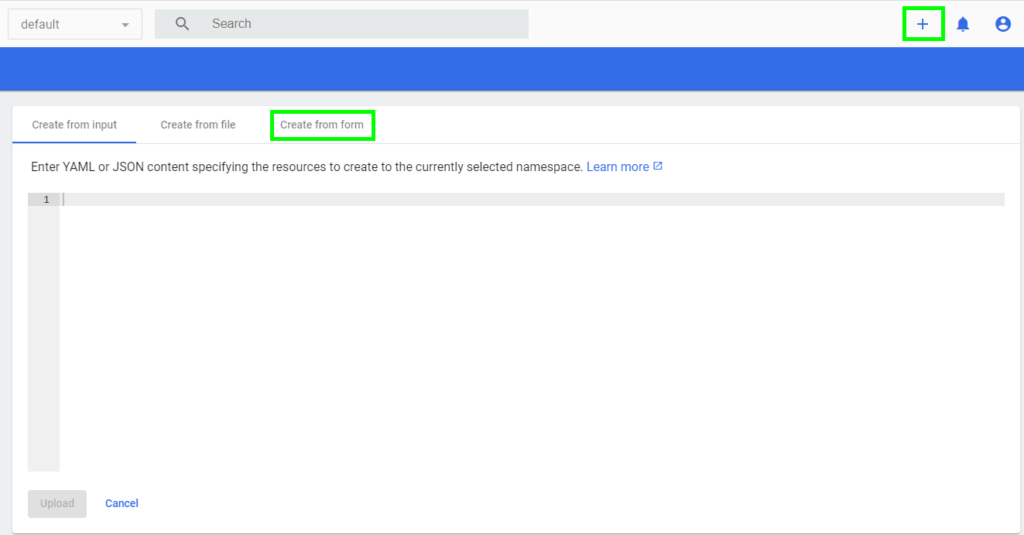
Create a simple app running an Nginx image with three replicas by inputting the values shown below:
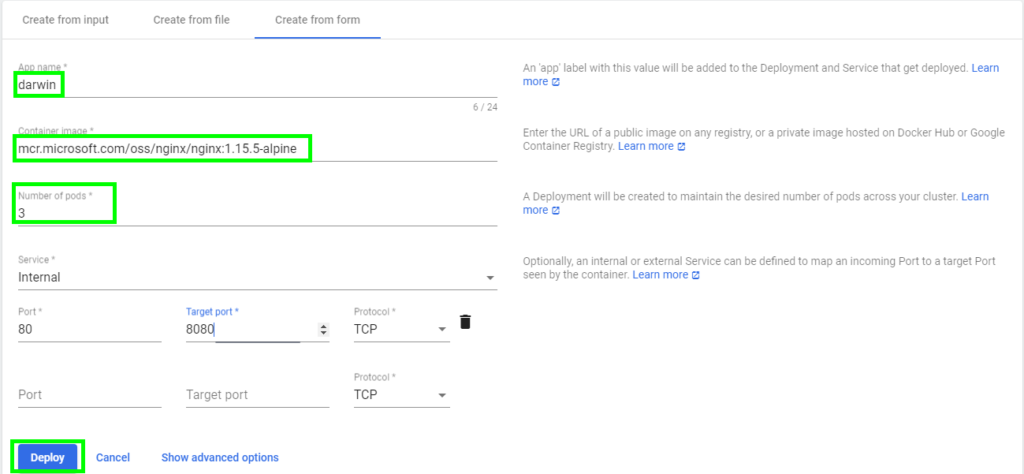
Once the details are confirmed, click on Deploy to deploy the workload into the cluster.
After deploying the application, the dashboard populates the Workloads view with the list of pods, replicas, and deployments, as shown:

Navigating to specific workloads involves a simple, click-based workflow. For instance, to access deployments, select the Deployments option from the Workloads menu:

To access the pods, select the Pods menu from the Workloads menu:
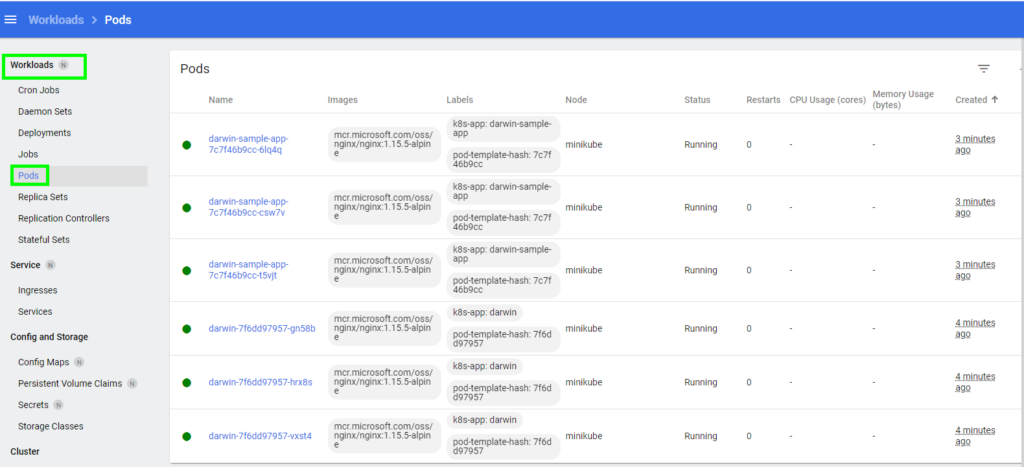
You can also use the dashboard to access, observe, and manage Services, Application Details, Cluster Events, and several other key metrics for observing the performance of a Kubernetes cluster:


Kubernetes Dashboard provides an intuitive, web-based UI that simplifies the deployment and management of your Kubernetes applications. It enables quick visibility and a click-based workflow for easier cluster management by users of all proficiency levels.
While the default dashboard offers basic features for smaller, non-production cluster management, observability tools such as Lens, ContainIQ, K9s, and Portainer extend the functionality of Kubernetes Dashboard, simplifying the monitoring, deployment, and management of production-grade, complex clusters at a global scale.
In the dynamic world of Kubernetes, container orchestration is just the tip of the iceberg....
This guide explores the challenges of RBAC implementation, best practices for managing RBAC in Kubernetes,...

In the evolving landscape of technology, cloud agnosticism has seen increasing traction. This refers to...